
History of the Market Regime Model - Part 1 (2010-2012)
2010-2012: Liquidity Shocks, Crises, and the Birth of a Bull Run

This article is part of a multi-part series where I walk through how the Market Regime model would have navigated different historical market environments. To keep things simple and transparent, I’m using TQQQ during Bullish regimes and GLD during Bearish regimes as proxies for how the system behaved in real time. Of course, past performance never guarantees future results—but understanding how a model responds across different conditions is exactly why I trade it live today. Seeing how it handled both calm and chaotic markets helps illustrate the consistency and robustness that make this approach so powerful.
In case you missed it, here’s links to the entire series:
Part1
From early 2010 through the end of 2012, markets lurched through one of the most unstable stretches of the post-2008 era. Confidence rose and collapsed in waves. Volatility came in sudden shocks. Fear and euphoria took turns steering the narrative. Most traders spent this period reacting to headlines, second-guessing every move, and trying—often unsuccessfully—to stay on the right side of a market that refused to behave.
And yet, the Market Regime model moved through this environment with remarkable clarity.
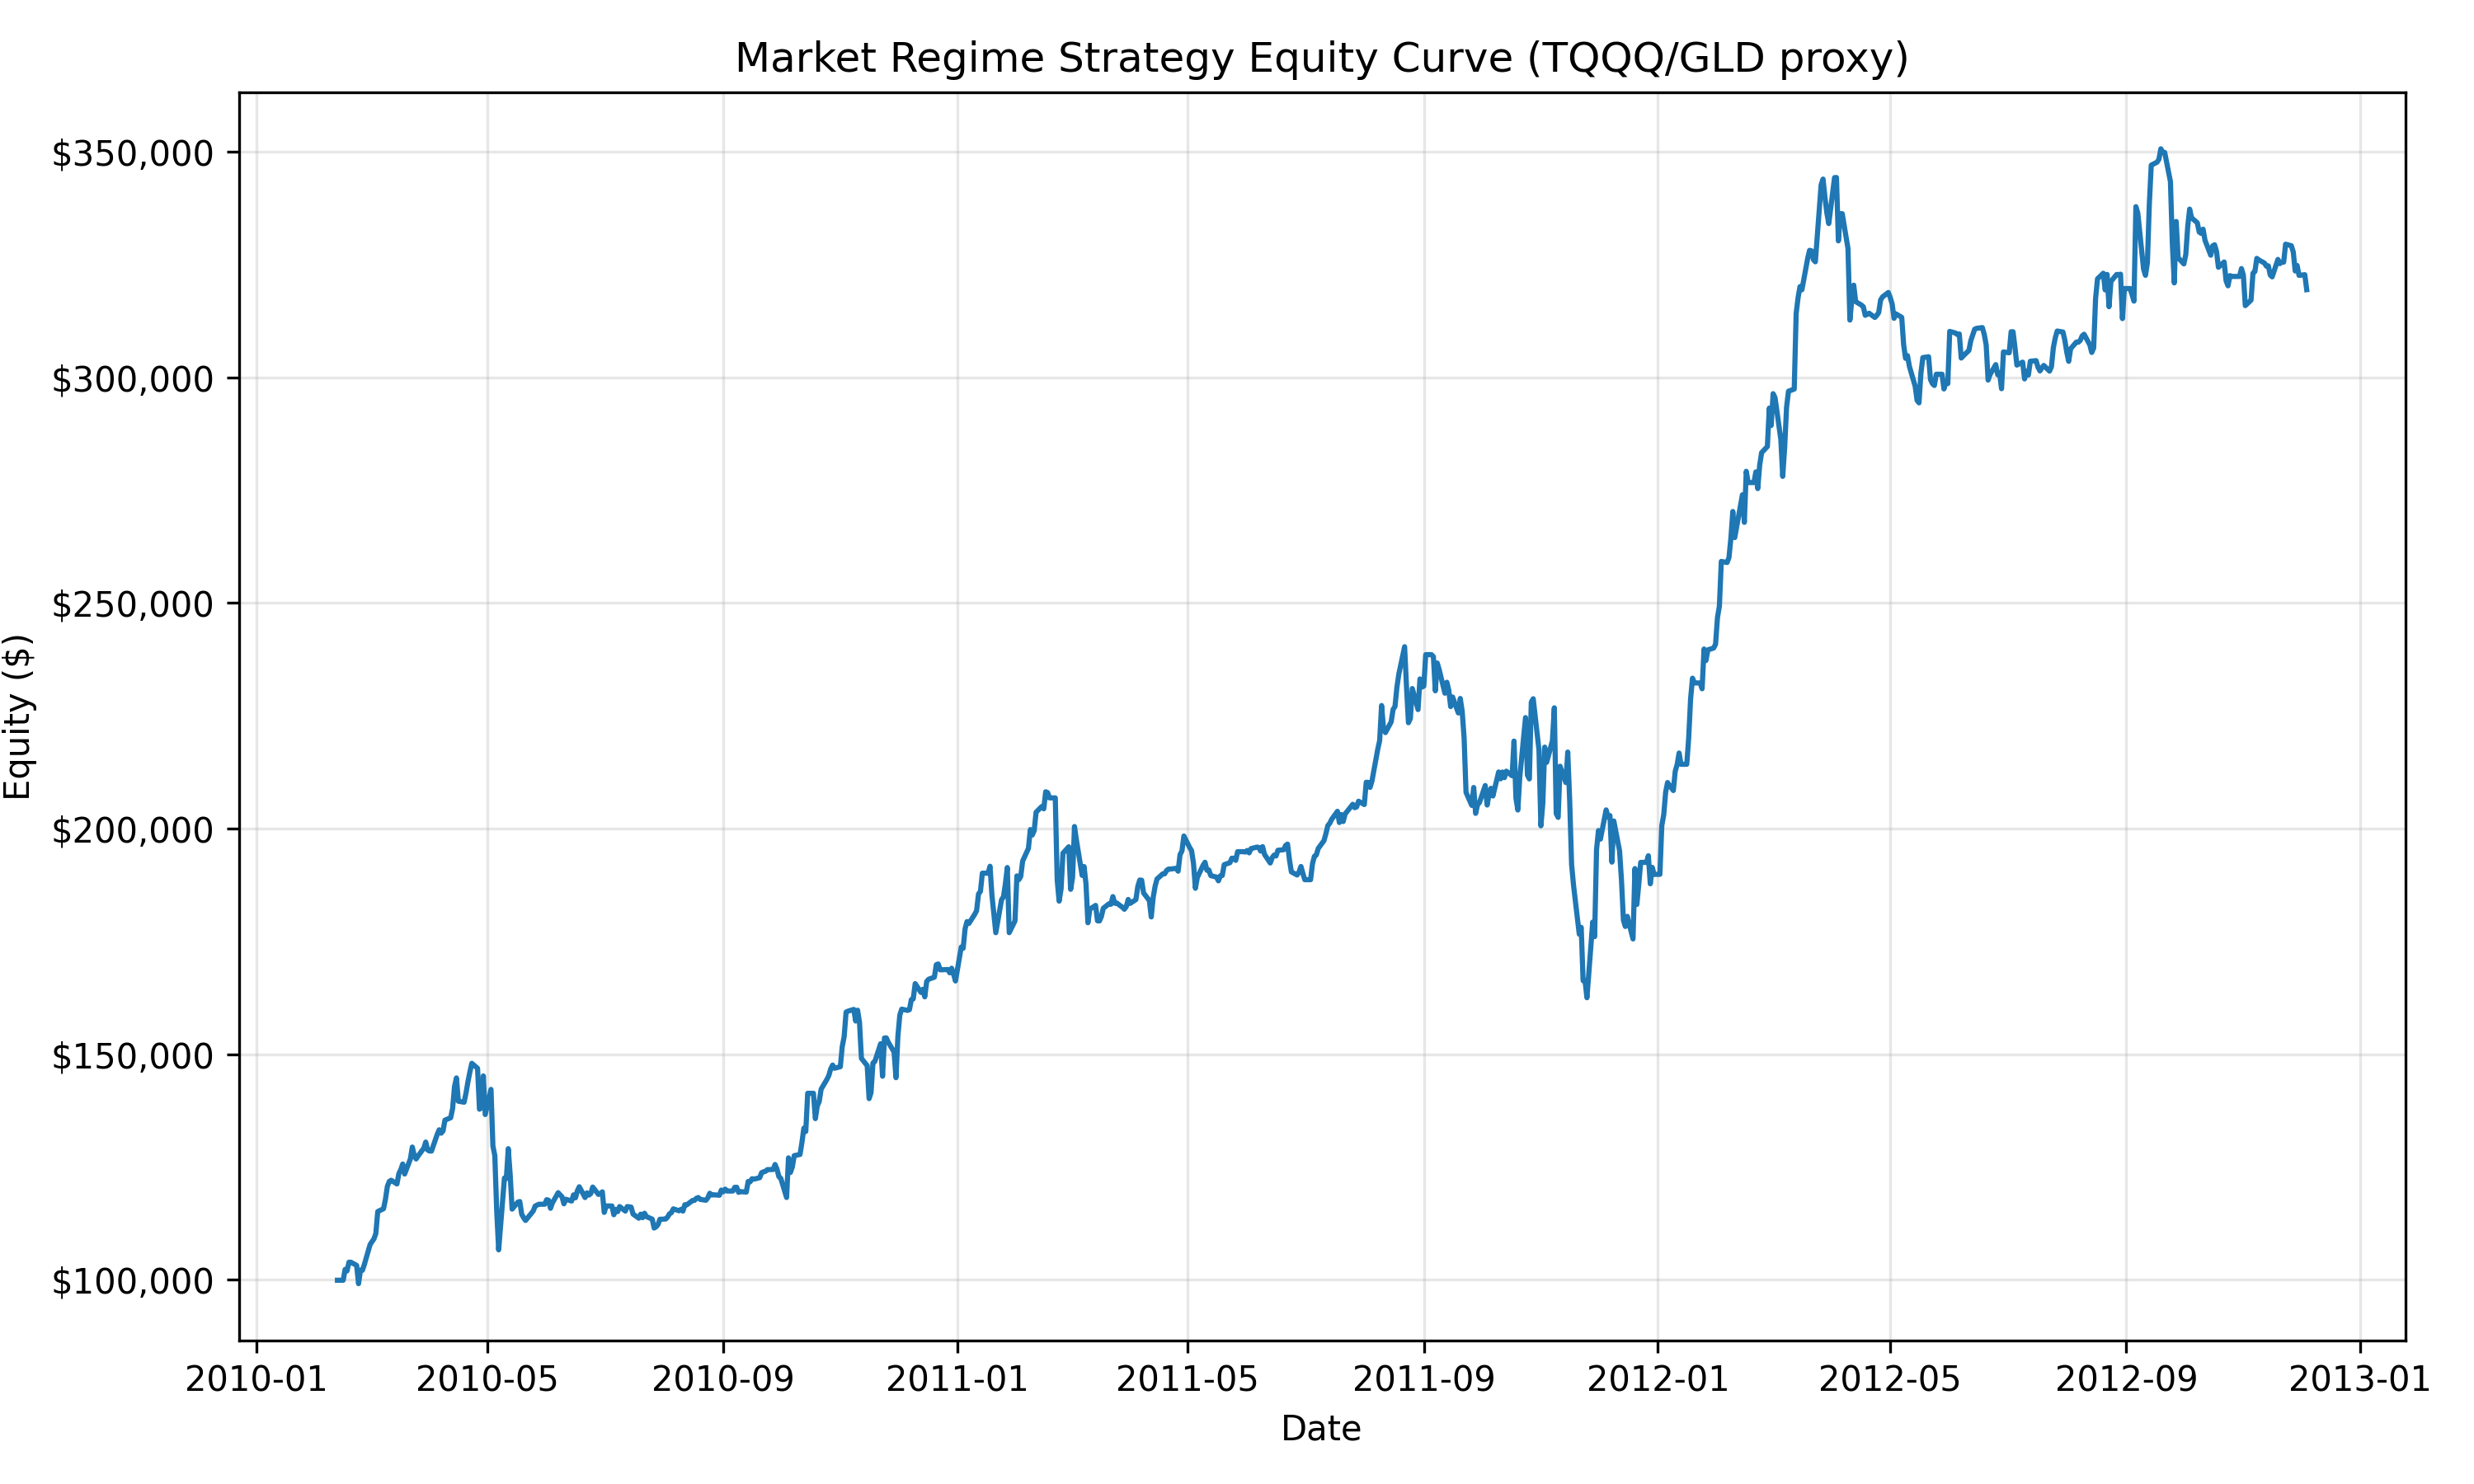
By doing nothing more than classifying each day as risk-on or risk-off and rotating between TQQQ in Bullish periods and GLD in Bearish periods, the strategy produced:
+219% total return, turning every $100k into roughly $319k
Roughly 51% annual return over the almost 3 year period (CAGR)
Fully invested every single day
Only 11 trades over nearly three years
73% of trades are profitable
This wasn’t achieved through prediction, forecasting, or reacting to news. It came from something much simpler and far more reliable: letting leadership speak for itself, and positioning accordingly.
Where human traders were often whipsawed by emotion, the model stayed disciplined. Where narratives shifted week to week, the model followed the underlying structure of markets—not opinions about them. And where uncertainty dominated, the model managed to extract extraordinary trends while sidestepping the worst parts of the turbulence.
The following breakdown shows exactly how the Market Regime navigated the 2010–2012 environment, trade by trade, with the same systematic logic that powers its performance today.
Phase 1 — Early recovery, Flash Crash, and Eurozone scares (Feb-Sep 2010)
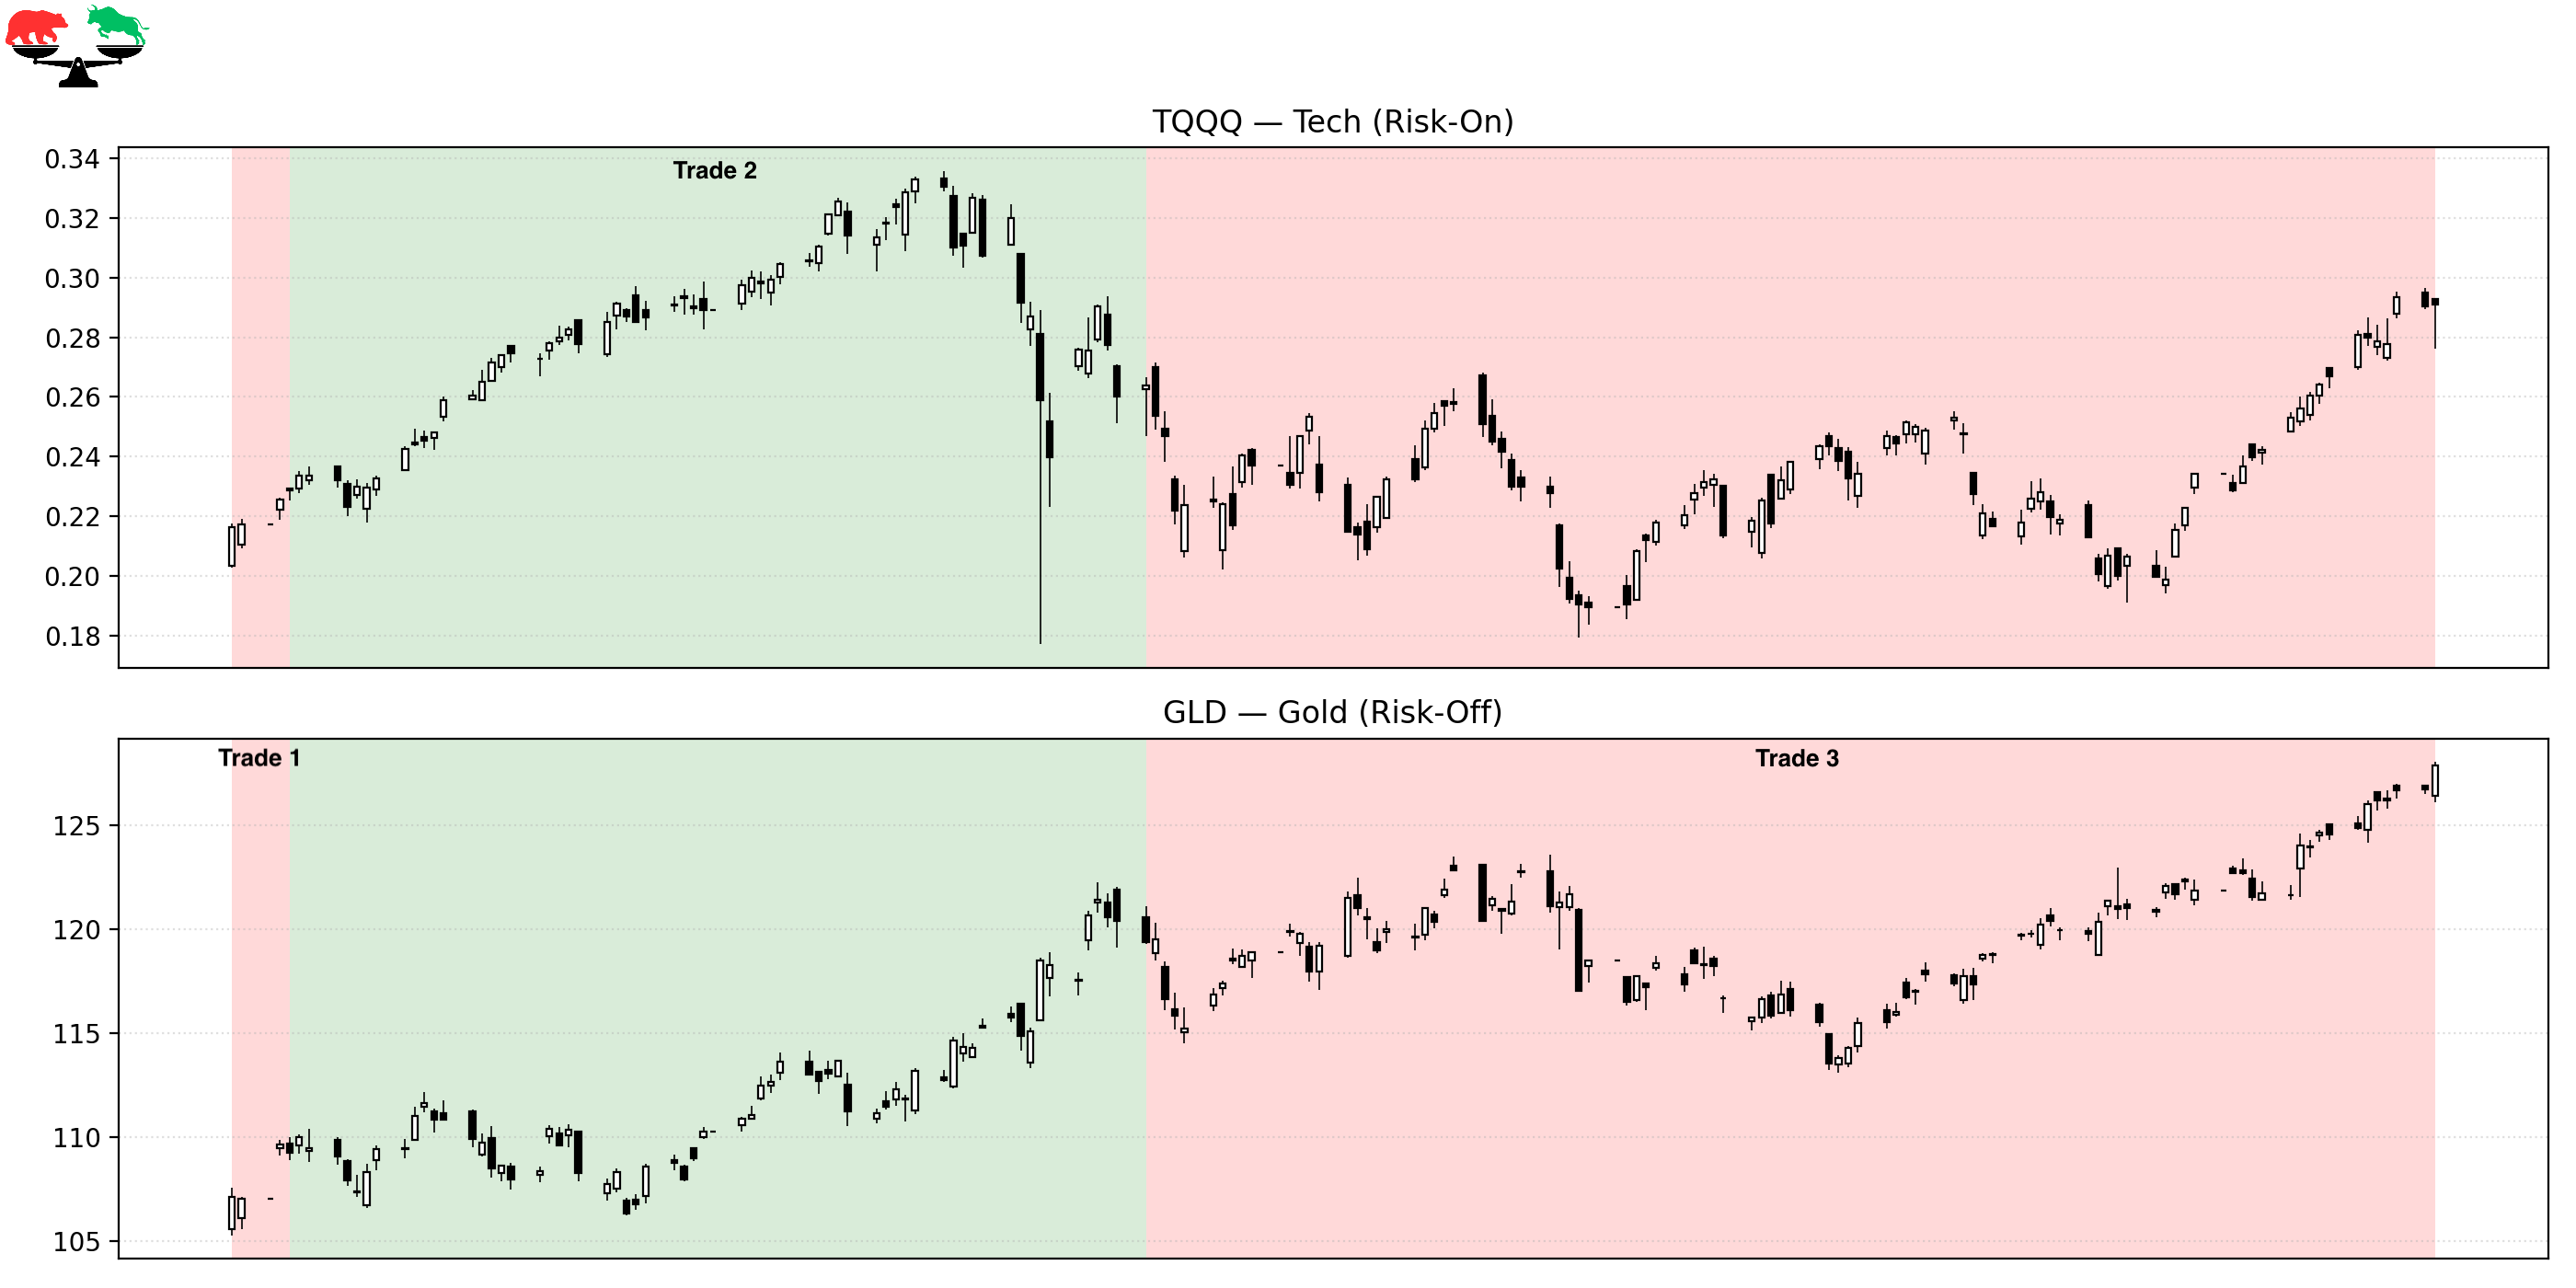
Trade 1 – A cautious start in a fragile recovery
Instrument: GLD
Start: 2010-02-11
End: 2010-02-17
Length: 6 days
Return: +1.98%
Markets were improving in early 2010, but confidence remained shaky. Economic data was uneven and Europe was beginning to show stress. The model stays defensive in GLD—appropriate for a period still overshadowed by the financial crisis hangover. A small gain, but more importantly: no risk-taking yet.
Trade 2 – The Flash Crash and the First Wave of the Eurozone Crisis
Instrument: TQQQ
Start: 2010-02-17
End: 2010-05-17
Length: 89 days
Return: +14.95%
This Bullish run includes one of the most chaotic moments of the entire decade: the May 6, 2010 Flash Crash, when markets plunged ~9% in minutes before snapping back.
It also overlaps with the first major Greek bailout concerns, which triggered volatility spikes and risk-off waves.
Despite the turmoil, the model remains long TQQQ until May 17, capturing +15%. This trade highlights a key feature of the strategy:
It doesn’t panic out of positions because of single-day anomalies—it responds only to sustained leadership shifts.
The flash crash created emotional damage for human traders. The regime model barely flinched.
Trade 3 – Investment Risk Remains Elevated After the Flash Crash
Instrument: GLD
Start: 2010-05-17
End: 2010-09-28
Length: 134 days
Return: +7.11%
After the flash crash and intensifying European concerns, risk-off leadership strengthens and the model rotates into GLD.
This wasn’t the heart of the crisis—that had passed—but markets still carried elevated risk premiums, funding concerns in Europe, and lingering fear from early-May volatility. Gold behaved exactly as expected: slow, steady, and defensive.
A +7% return over ~4 months, while staying out of a messy equity environment.
Phase 2 — QE2 Strength, Then the Descent Into the 2011 Crisis (Sep 2010-Oct 2011)
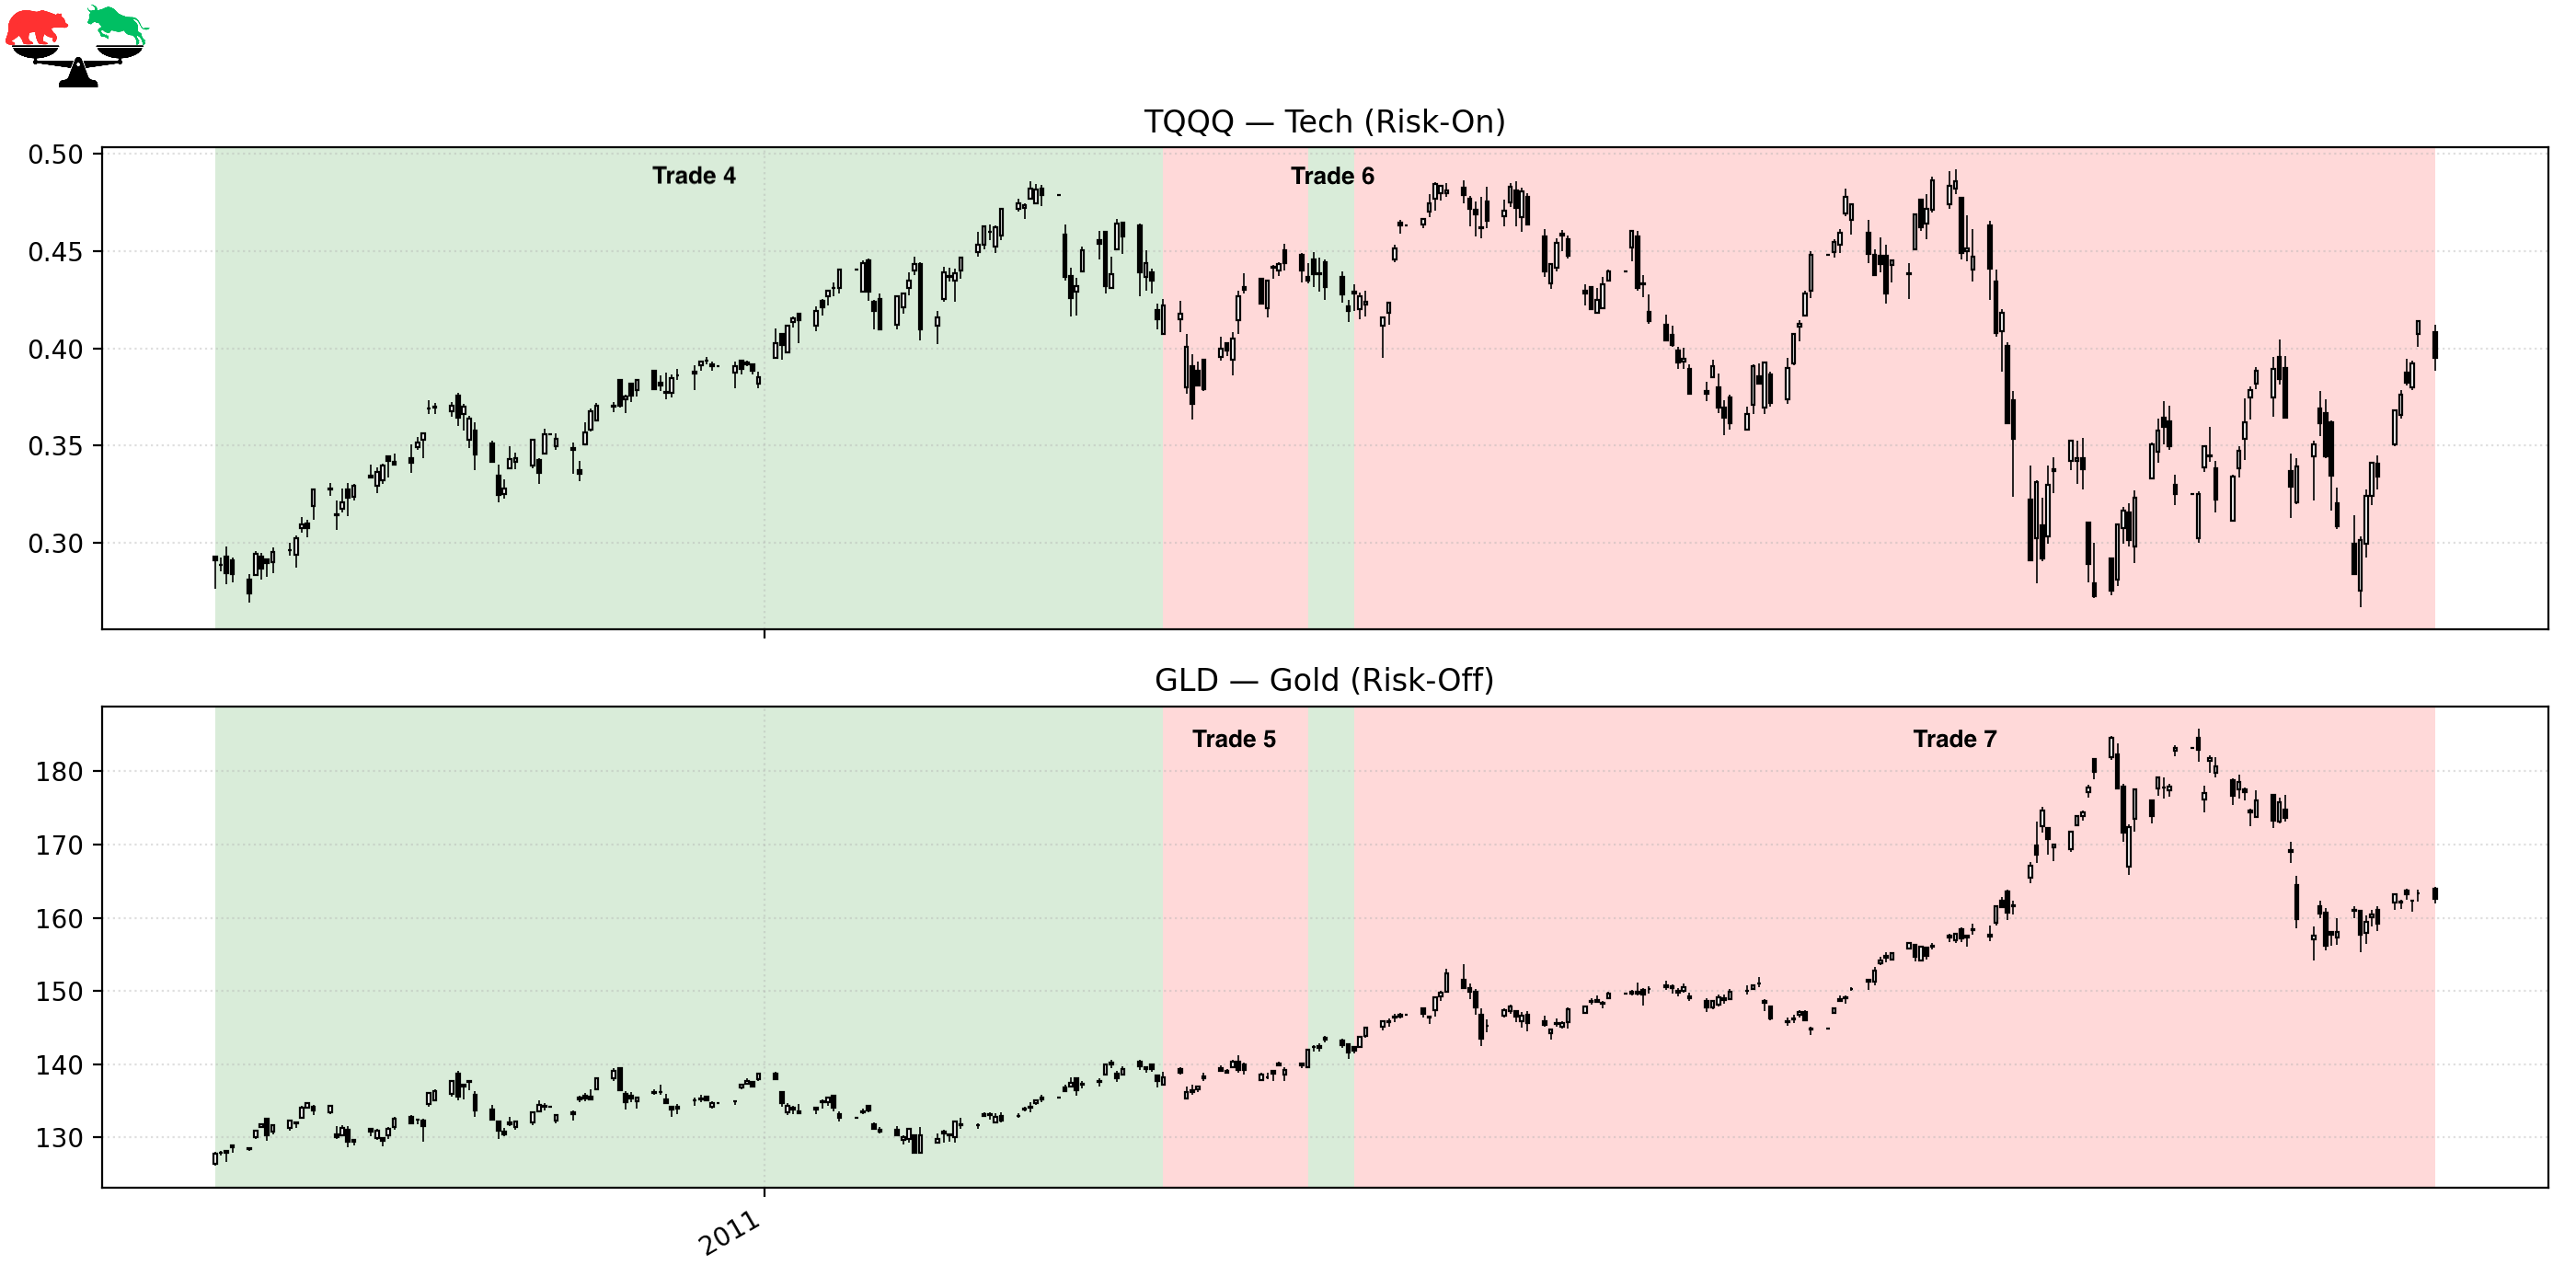
Trade 4 – The QE2 Liquidity Surge
Instrument: TQQQ
Start: 2010-09-28
End: 2011-03-11
Length: 164 days
Return: +45.05%
In late 2010, markets began pricing in Federal Reserve QE2, which ignited a powerful risk-on environment. Growth and tech leadership expanded sharply.
The regime flips Bullish, enters TQQQ, and captures nearly +45% as liquidity expectations lift the entire market. This was one of the cleanest trending periods of the decade, and the model stayed positioned perfectly for it.
Trade 5 – Global Supply Shocks and Rising Uncertainty
Instrument: GLD
Start: 2011-03-11
End: 2011-04-05
Length: 25 days
Return: +2.77%
March 11, 2011 marks the Japan earthquake and Fukushima nuclear disaster, which sent shockwaves through global markets. Commodity inflation remained elevated, Middle East unrest persisted, and volatility ticked higher.
Risk-off leadership strengthened and the model rotated into GLD, earning a small but steady +2.8%.
Trade 6 – A Brief Bullish Bluff
Instrument: TQQQ
Start: 2011-04-05
End: 2011-04-13
Length: 8 days
Return: –1.31%
In early April, a short-lived improvement in leadership triggers a Bullish signal, but deteriorates quickly. A small loss—the kind that systematic traders simply accept as part of the process.
Trade 7 – The 2011 U.S. Debt-Ceiling Crisis and Equity Meltdown
Instrument: GLD
Start: 2011-04-13
End: 2011-10-17
Length: 187 days
Return: +14.6%
This trade covers the entire U.S. debt-ceiling showdown, the August 2011 U.S. credit downgrade, and the worsening Eurozone sovereign crisis. Volatility skyrocketed. Equities dropped sharply. Sentiment collapsed.
The model had already rotated into GLD months before the panic, and stayed there throughout the storm.
Gold became one of the strongest assets in the world during this period.
The model earns +14.6% while equity markets experienced deep, psychologically brutal drawdowns.
This is one of the best demonstrations of the model’s defensive power.
Phase 3 — Liquidity Firehose and the Birth of the 2012 Bull Run (Oct 2011 - Dec 2012)
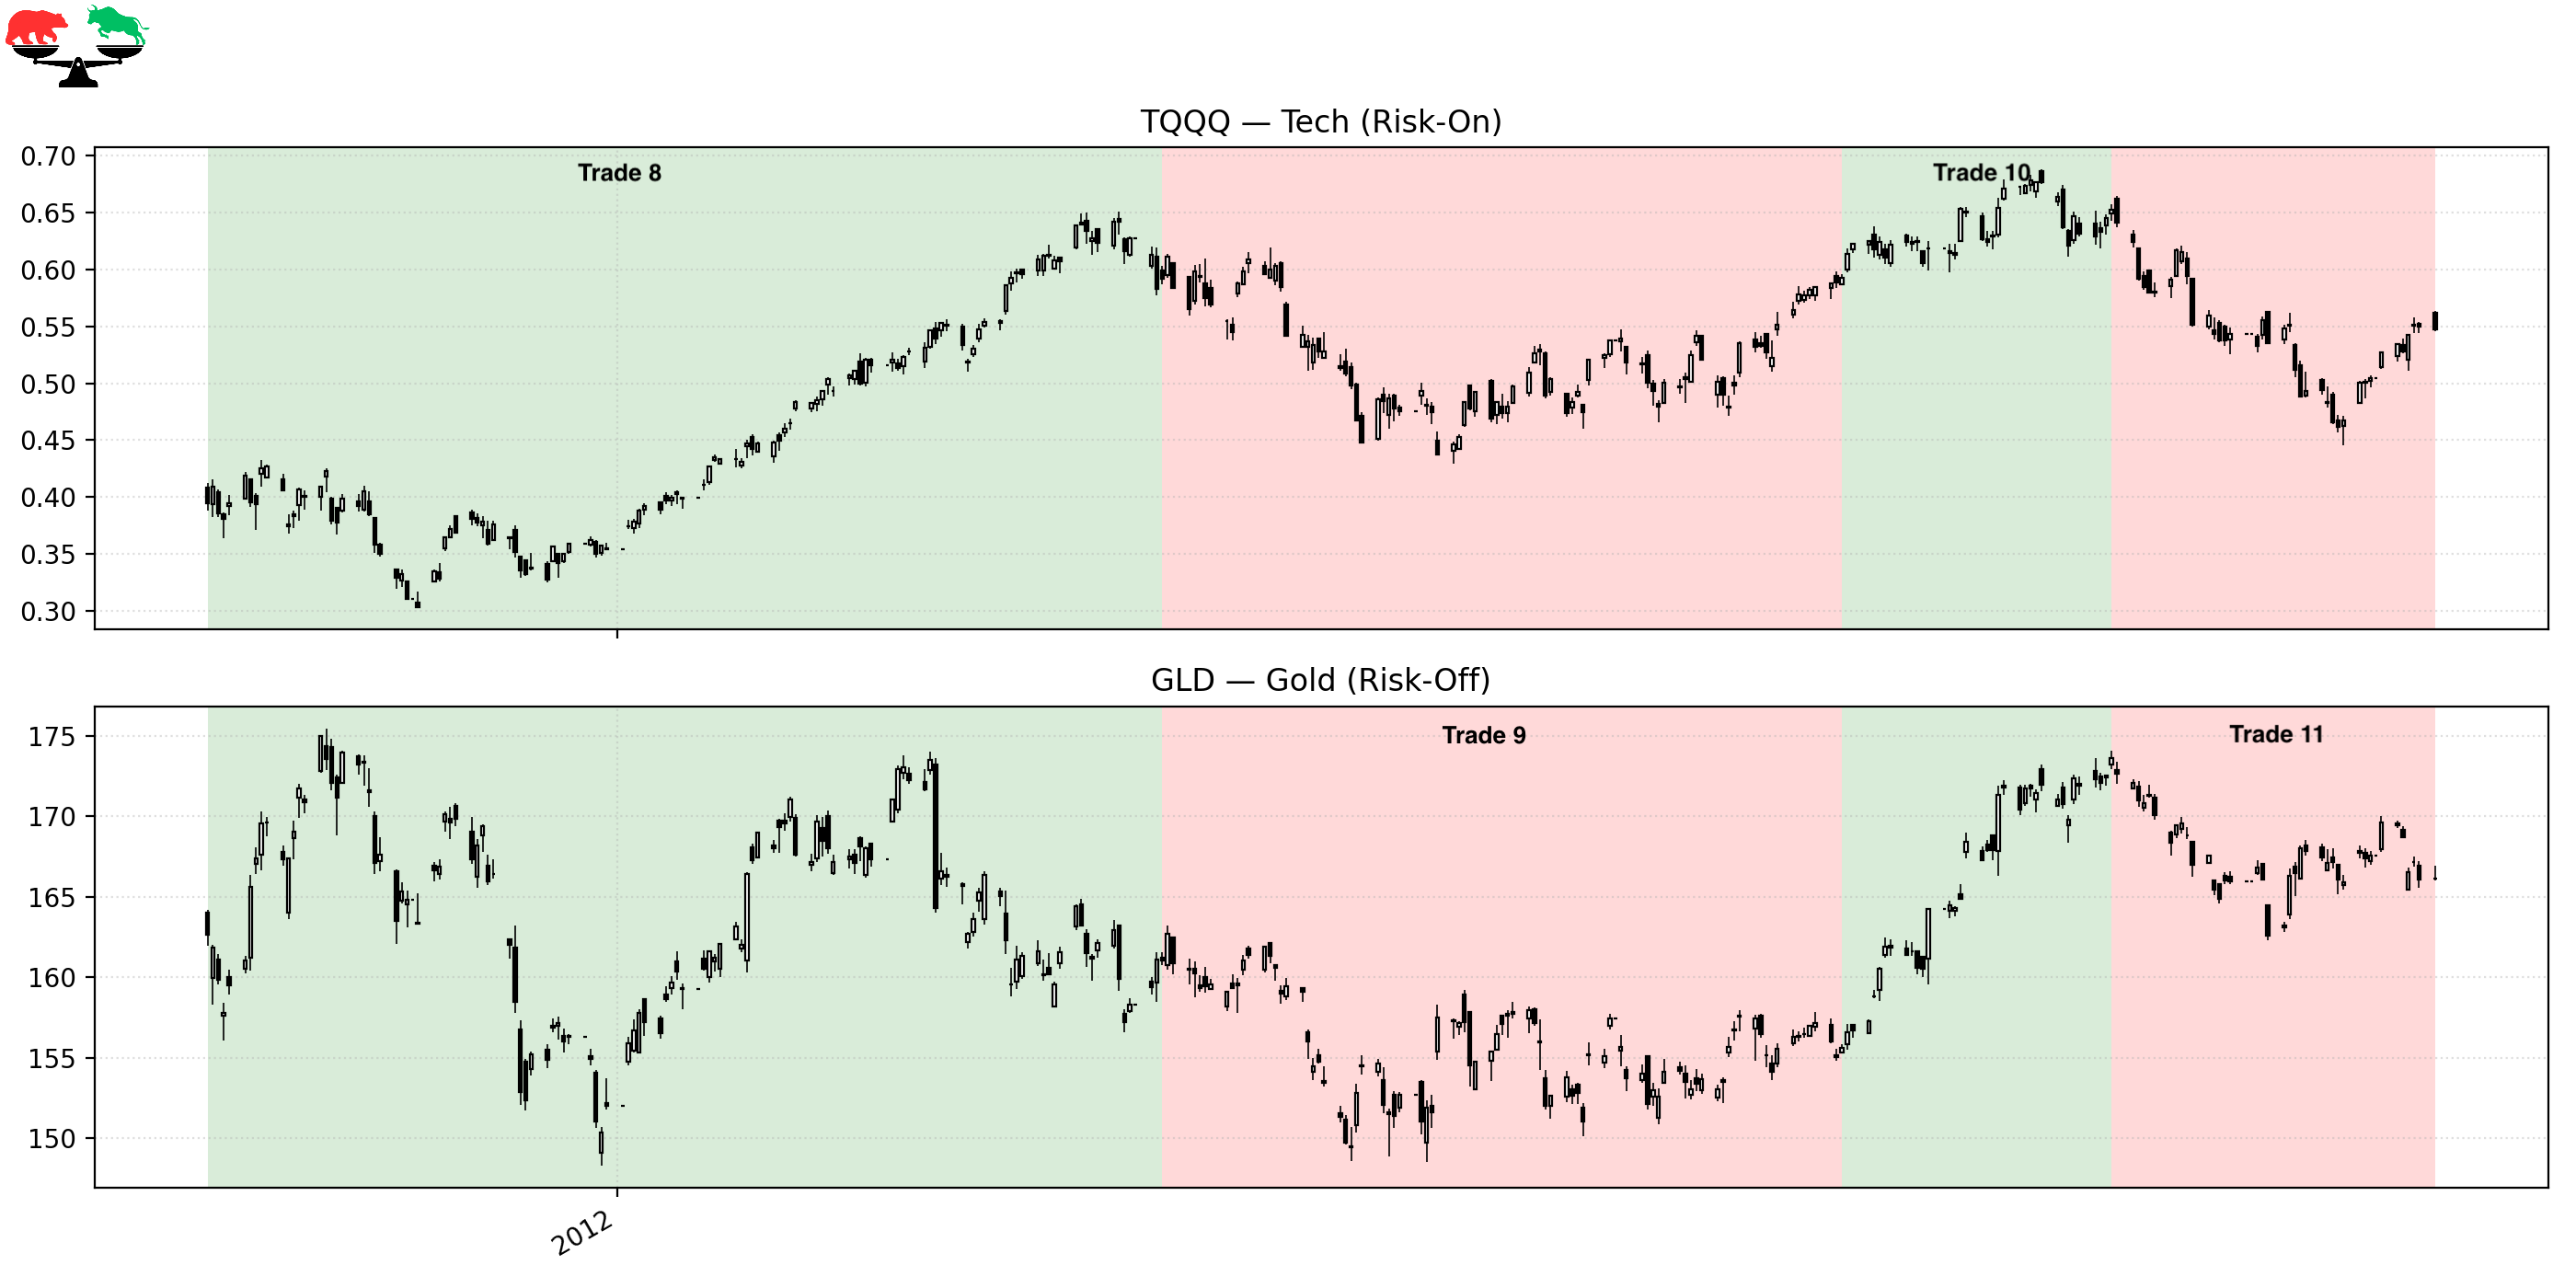
Trade 8 – The Monster LTRO-Fueled Rally
Instrument: TQQQ
Start: 2011-10-17
End: 2012-04-11
Length: 177 days
Return: +49.84%
After the August–October 2011 turmoil, risk-on leadership began quietly improving beneath the surface. The regime flips Bullish in mid-October—before the narrative turned optimistic.
Then comes the catalyst:
December 2011, when the ECB unleashes its LTRO liquidity injection and central banks coordinate to lower USD funding stress.
That flood of liquidity ignites a powerful global rally. Growth and tech lead decisively. TQQQ explodes higher.
The model captures nearly +50%—its biggest winner of the entire period.
Trade 9 – Risk-Off in a Slower, Choppier Environment
Instrument: GLD
Start: 2012-04-11
End: 2012-08-15
Length: 126 days
Return: –3.38%
European stress resurfaces in mid-2012, economic data softens, and risk-on leadership fades. The model rotates to GLD, but gold struggles this time. A small loss, contained and disciplined.
Trade 10 – A Clean QE3 Anticipation Rally
Instrument: TQQQ
Start: 2012-08-15
End: 2012-10-04
Length: 50 days
Return: +10.04%
Markets firm again on improving U.S. data and expectations of QE3, announced in September. The regime turns Bullish, enters TQQQ, and takes another solid +10% gain.
Trade 11 – A Quiet Defensive Close to the Period
Instrument: GLD
Start: 2012-10-04
End: 2012-12-04
Length: 60 days
Return: –5.29%
The period ends in a Bearish regime with GLD drifting modestly lower. A small defensive loss that keeps the model out of trouble during a less favorable tape.
FINAL THOUGHTS
Here’s a recap of the trades taken during this period:
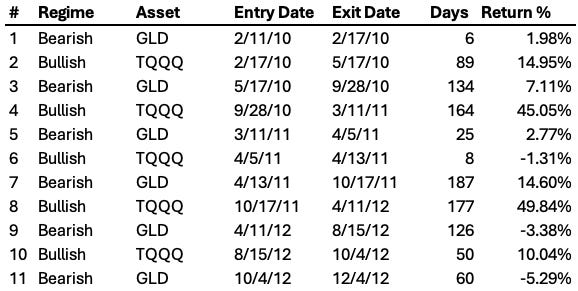
Across nearly three years of turbulence, the Market Regime model produced:
+219% total return
~51% CAGR
Minimal drawdown exposure
Only 11 trades
~73% win rate
It caught the liquidity-driven bull runs, sidestepped the worst collapses, and handled volatility with discipline that few discretionary traders can match.
Coming Next: 2013–2015 — A Trendless Market, Taper Tantrum Volatility, and the Model’s Most Difficult Environment Yet
The next installment in this series covers 2013–2015, a period defined not by dramatic crashes or liquidity shocks, but by something far more challenging for systematic traders: a market that goes nowhere for long stretches at a time.
These historical reports show how the model handled the past.
Paid subscribers get to see how it handles the present.
If you want the same clarity in your trading today that this model brought to 2010–2012, join the paid community and follow along in real time.