
History of the Market Regime Model - Part 2 (2012-2015)
2012–2015: Slow Melt-Ups, Sudden Shocks, and a Model That Stayed One Step Ahead
This article is part of a multi-part series where I walk through how the Market Regime model would have navigated different historical market environments. To keep things simple and transparent, I’m using TQQQ during Bullish regimes and GLD during Bearish regimes as proxies for how the system behaved in real time. Of course, past performance never guarantees future results—but understanding how a model responds across different conditions is exactly why I trade it live today. Seeing how it handled both calm and chaotic markets helps illustrate the consistency and robustness that make this approach so powerful.
In case you missed it, here’s links to the entire series:
Part2
If 2010–2012 showcased how the Market Regime model converts chaos into opportunity, then 2012–2015 revealed a very different challenge: extended bullish trends interrupted by short, violent corrections and rising macro crosscurrents.
This period opened with the tailwinds from the ECB’s LTRO liquidity injection and the U.S. Fed’s ongoing accommodative stance. 2013 delivered one of the strongest melt-up years in modern market history. But beneath the surface, risks began accumulating:
The Taper Tantrum jolted markets in mid-2013
The 2014 oil collapse destabilized credit markets
The surging U.S. dollar pressured commodities and emerging markets
Early 2015 showed topping behavior, with divergences across major indices
Human traders struggled with a market that looked strong until it suddenly wasn’t. But the Market Regime model stayed grounded in relative strength: holding TQQQ during true bullish leadership, flipping into GLD during deteriorating environments, and avoiding the emotional whiplash that defined this period.
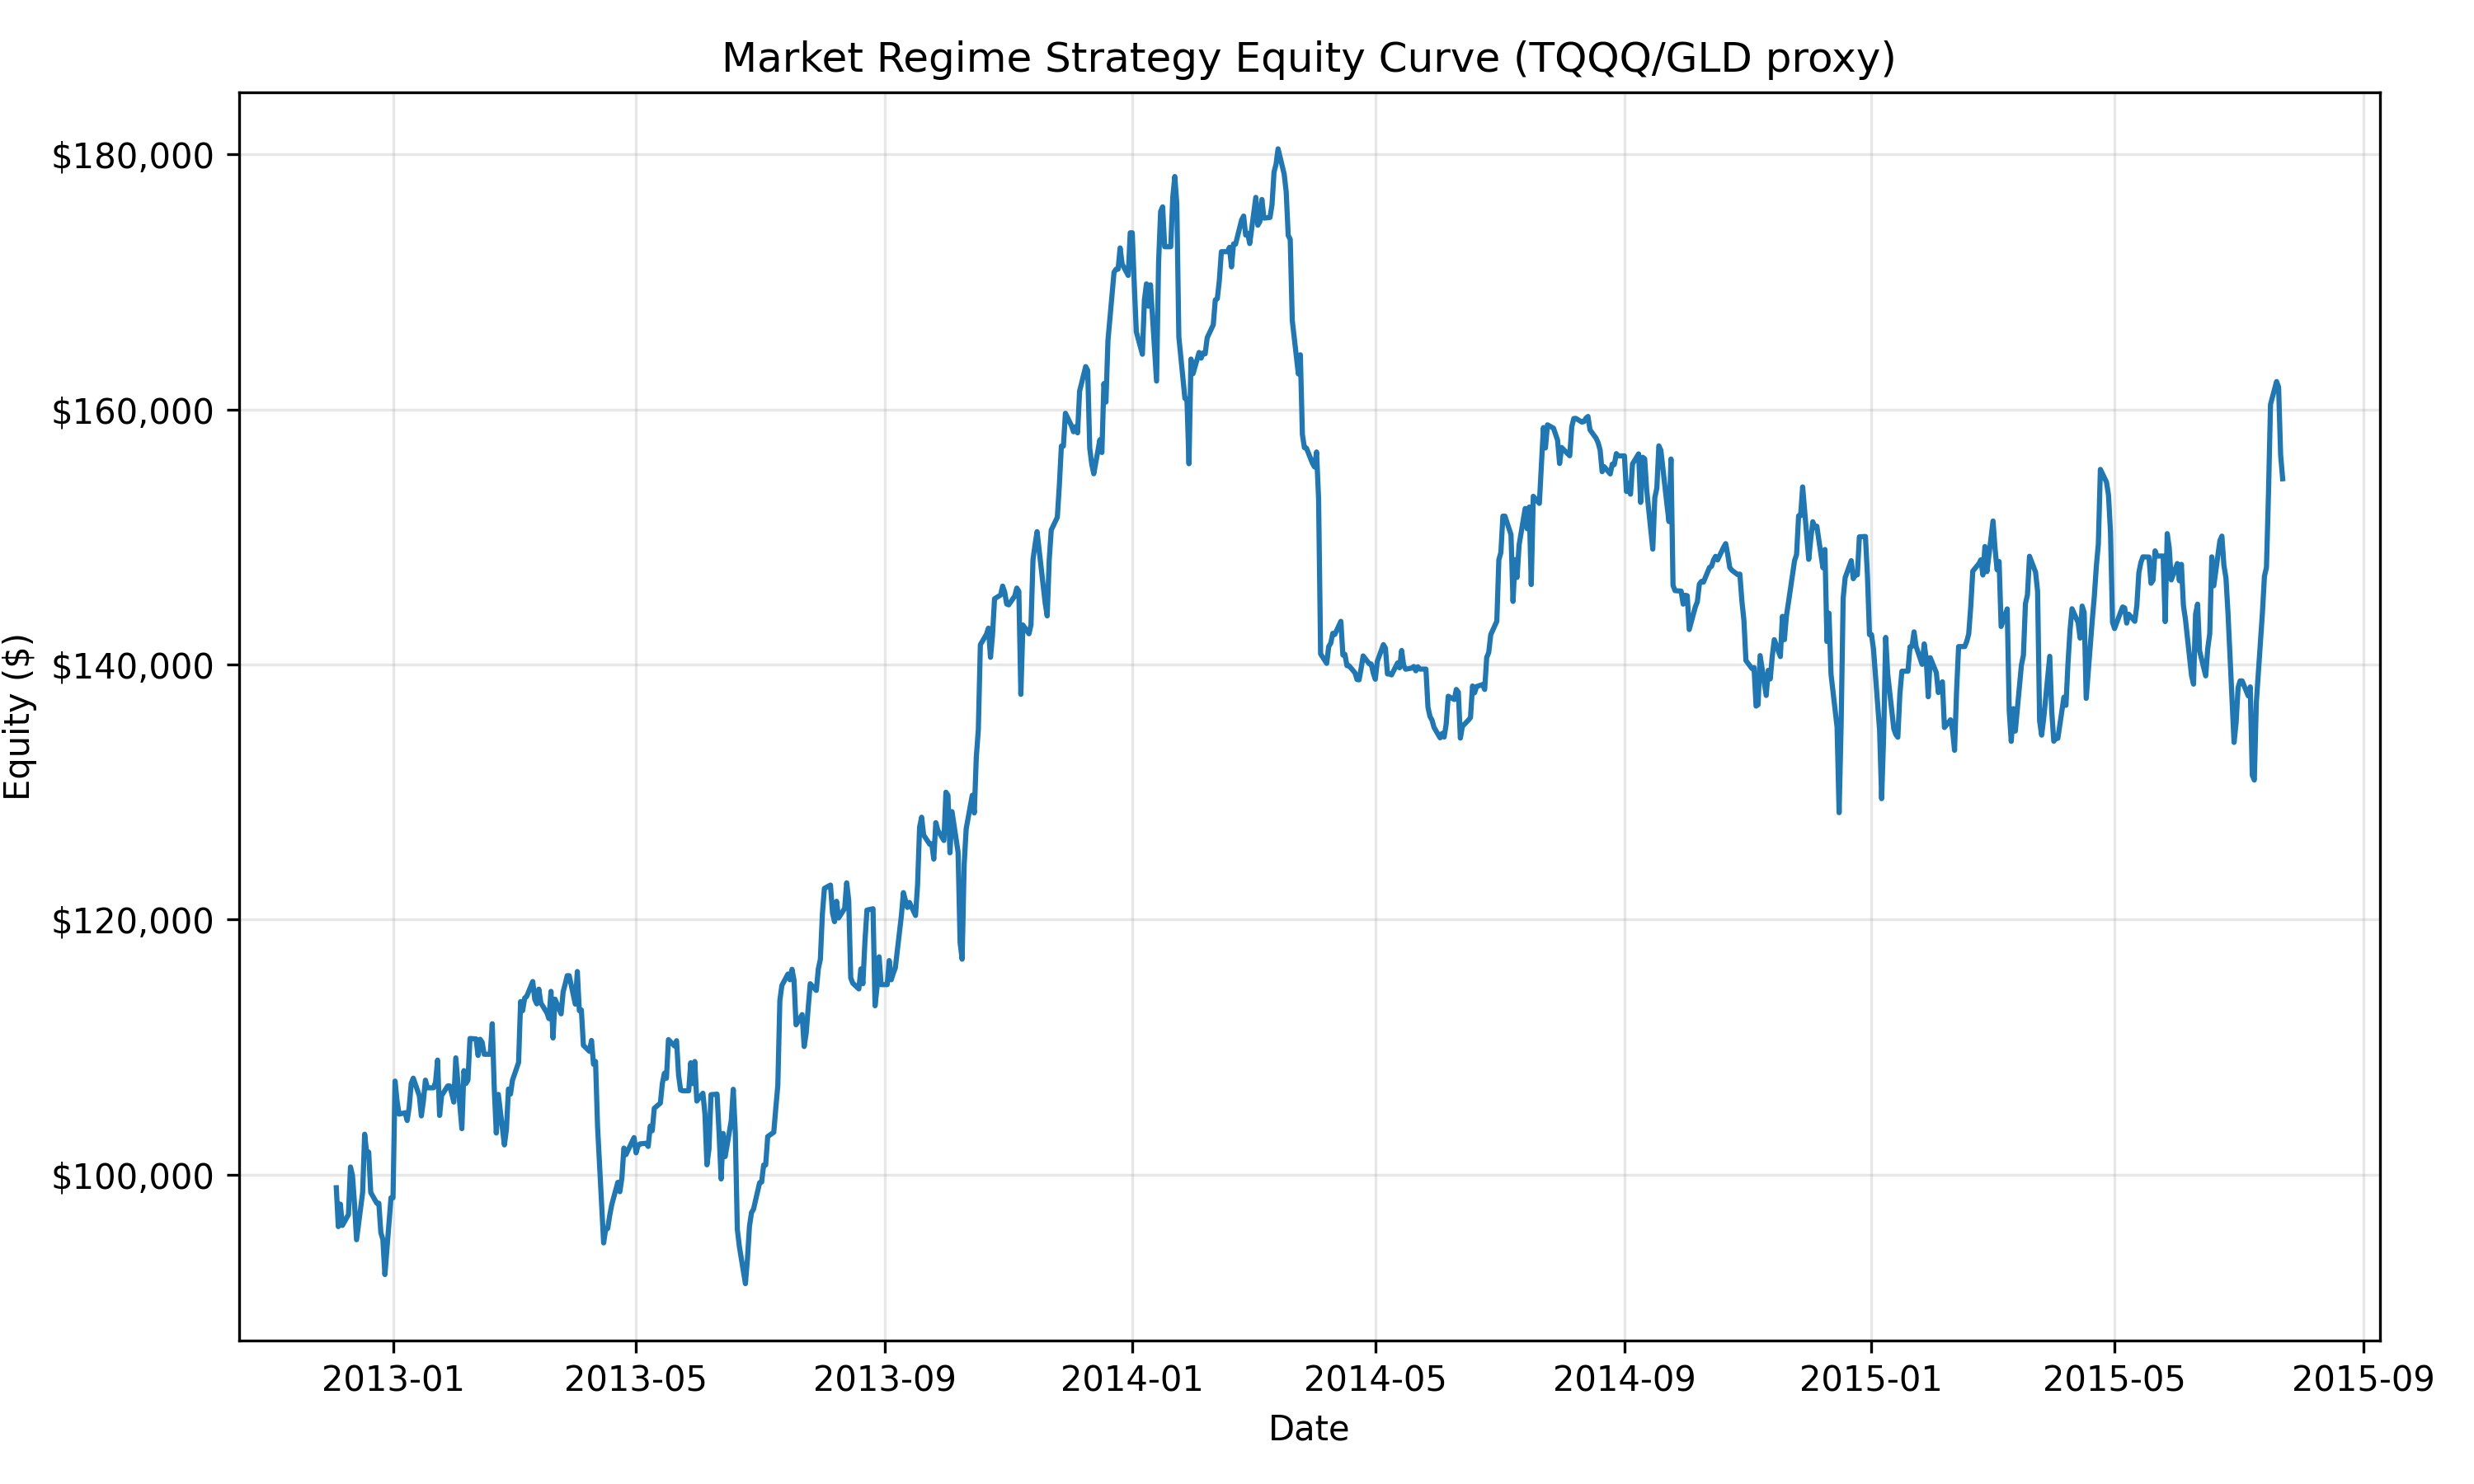
Using nothing more than a daily classification of risk-on versus risk-off leadership, the model produced:
+56.16% total return
+18.46% CAGR
total of 19 trades during this 2.6-year window
PHASE 1 — Late 2012 Through Mid-2013: Lift-Off and the Taper Tantrum
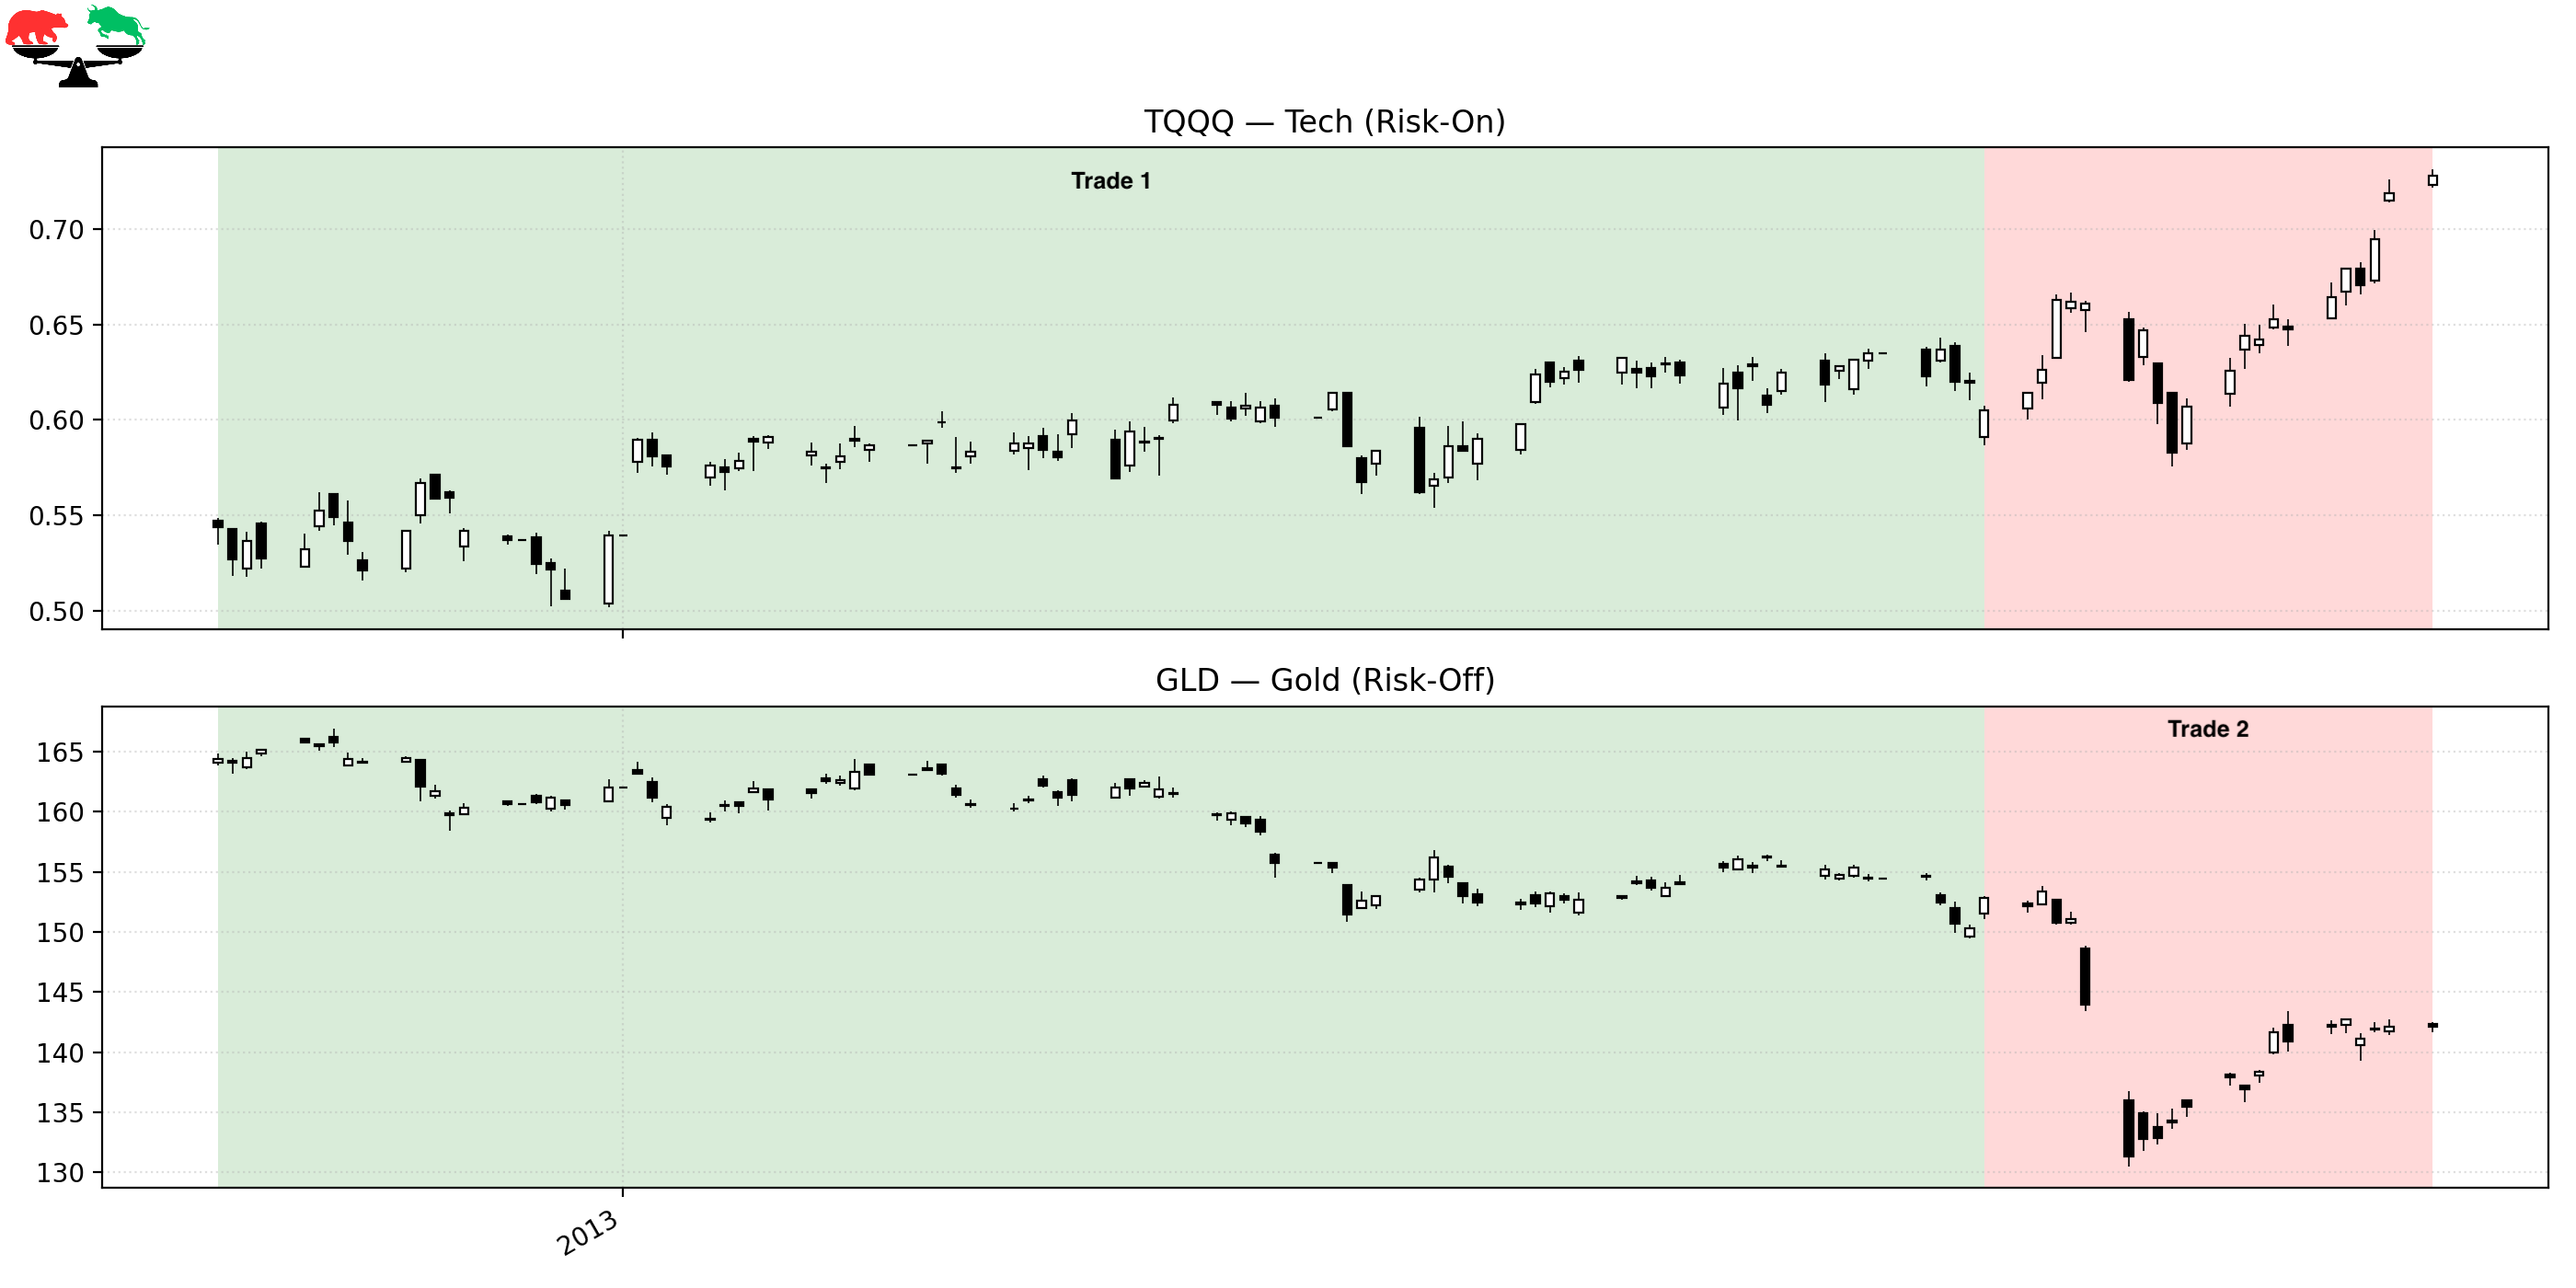
Trade 1 – Riding the Early-2013 Momentum
Instrument: TQQQ
Start: 2012-12-04
End: 2013-04-05
Length: 122 days
Return: +11.28%
Markets continued their LTRO-fueled momentum from late 2012. Employment data strengthened, volatility compressed, and TQQQ steadily churned higher. The model stayed long throughout this smooth, low-stress advance.
Trade 2 – Defensive Positioning Before the Taper Tantrum
Instrument: GLD
Start: 2013-04-05
End: 2013-05-06
Length: 32 days
Return: –6.98%
As the Fed began hinting at winding down QE, volatility rose and leadership weakened, triggering a Bearish regime. Gold itself was not strong in 2013, but the defensive rotation successfully avoided the sharper drawdowns that hit leveraged tech exposure during this window. Markets entered a choppy, uncertain phase often referred to as the early “Taper Tantrum,” and the model appropriately stepped aside. Although the trade posted a loss, it reflected the system’s discipline during policy-driven instability.
PHASE 2 — Mid-2013 Through 2014: A Strong Trend with Hidden Cracks
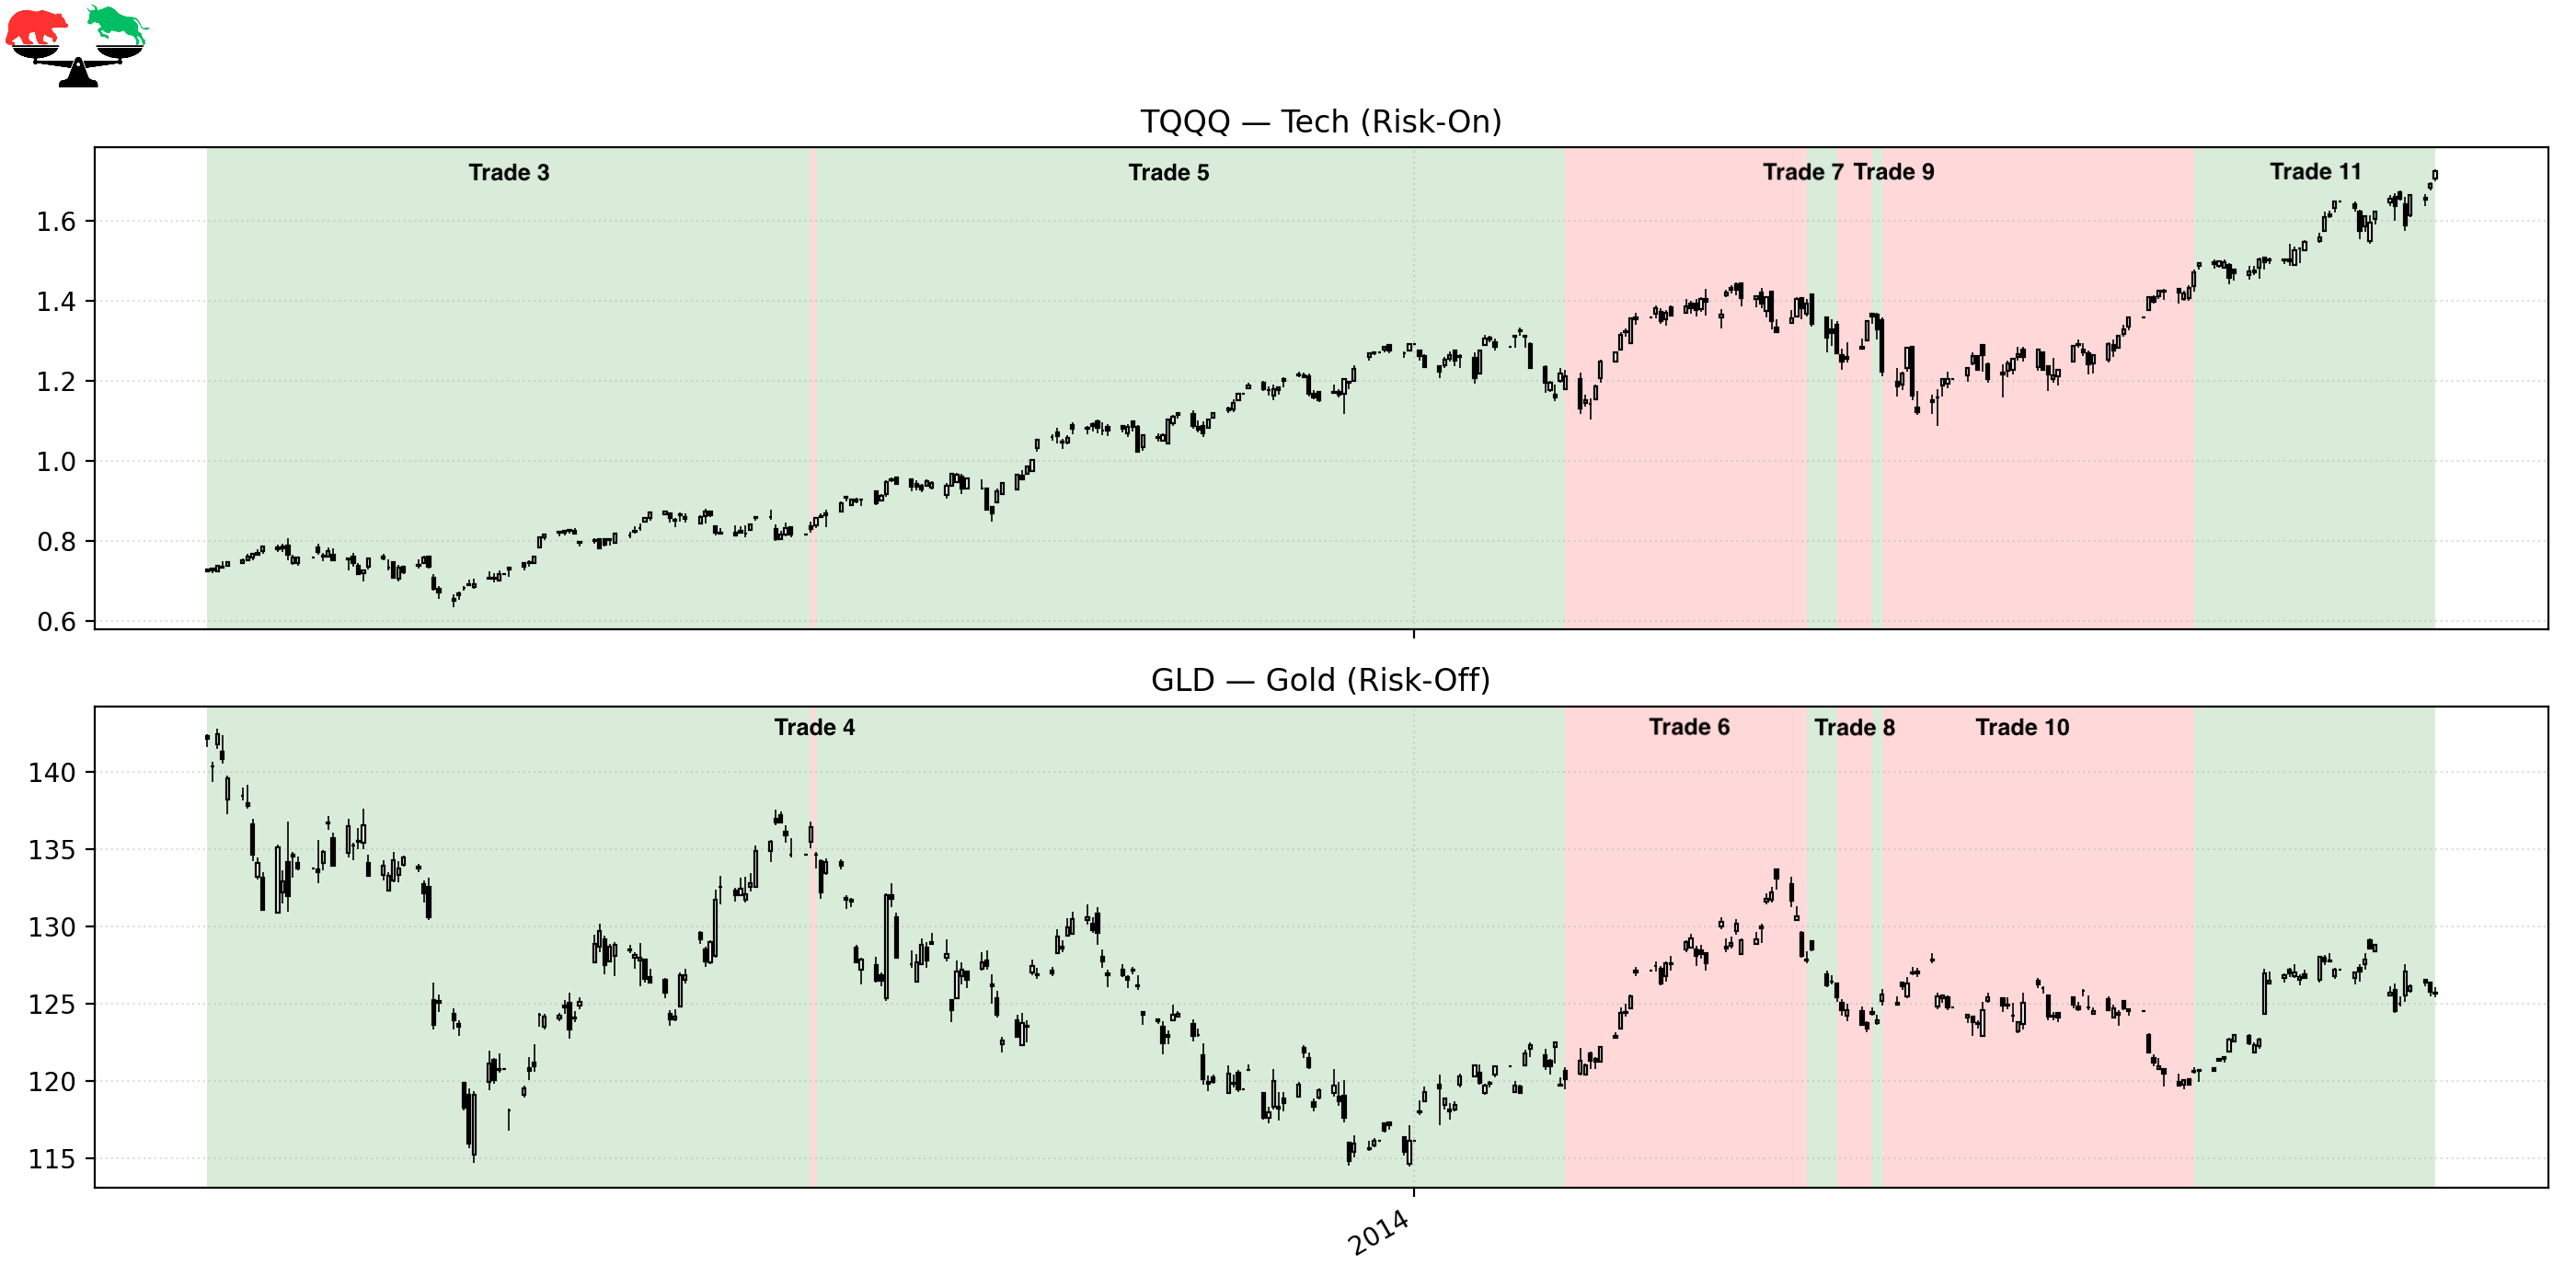
Trade 3 – Rejoining the 2013 Melt-Up
Instrument: TQQQ
Start: 2013-05-06
End: 2013-09-03
Length: 121 days
Return: +13.99%
Once markets adjusted to the Fed’s taper stance, risk-on leadership returned in force. Growth stocks surged, volatility collapsed again, and the S&P 500 marched steadily higher. The model re-entered TQQQ just as momentum was reasserting itself, allowing it to capture a large portion of one of the strongest summer rallies of the decade. This was a classic, sustained trend—the kind systematic models thrive in.
Trade 4 – A One-Day Bearish Flicker
Instrument: GLD
Start: 2013-09-03
End: 2013-09-04
Length: 1 day
Return: –1.29%
A brief leadership wobble triggered a momentary defensive flip. Markets occasionally weaken just enough to trip the regime before recovering immediately, and this was one of those scenarios. The trade lost a small amount, but displays the system’s willingness to respond quickly when relative strength deteriorates. By the next day, risk-on leadership had returned, and the model moved back accordingly.
Trade 5 – The Best Trade of the Period
Instrument: TQQQ
Start: 2013-09-04
End: 2014-01-31
Length: 150 days
Return: +41.23%
This is the powerhouse trade of the entire 2012–2015 stretch. Markets rallied strongly into the end of 2013, driven by improving economic conditions, strong earnings, and surprisingly positive market reaction to the Fed’s taper schedule. TQQQ surged as tech and growth regained firm leadership. The model held through the entire move, fully benefiting from one of the cleanest trend periods of the period.
Trade 6 – Defensive Rotation into EM Stress
Instrument: GLD
Start: 2014-01-31
End: 2014-03-20
Length: 48 days
Return: +6.47%
The start of 2014 brought sudden turbulence: emerging-market currencies sold off, biotech stocks entered correction territory, and volatility resurfaced. The model’s shift into GLD reduced exposure to these shocks and provided modest positive return during a destabilizing environment. Gold served its purpose—not as a major outperformer, but as a buffer when risk-on assets faltered. This rotation showed the value of having a clear defensive mechanism.
Trade 7 – Failed Breakout and Volatility Spike
Instrument: TQQQ
Start: 2014-03-20
End: 2014-03-26
Length: 6 days
Return: –8.83%
Markets attempted to break higher in late March, but the effort collapsed almost immediately. Leadership weakened, credit spreads widened, and volatility surged, all signaling instability. The regime model entered the trade because conditions briefly looked favorable, but the rapid reversal produced one of the worst losses of this period. Quick whipsaws like this are inevitable in trend-following systems—but they are the price paid for participating when true breakouts do occur.
Trade 8 – Back to Safety During Market Digestion
Instrument: GLD
Start: 2014-03-26
End: 2014-04-02
Length: 7 days
Return: –0.87%
After the failed breakout, the system quickly pivoted back into GLD as risk conditions deteriorated. Although gold did not provide meaningful upside, the important thing was avoiding deeper losses in TQQQ. By stepping aside, the model reduced volatility and waited for leadership to re-emerge. This type of small, controlled defensive posture is a hallmark of robust regime-based systems.
Trade 9 – A Two-Day Bullish Feint
Instrument: TQQQ
Start: 2014-04-02
End: 2014-04-04
Length: 2 days
Return: –10.11%
Market momentum briefly turned positive, enough to trigger a Bullish signal—only to fail almost instantly. This was a highly unstable period characterized by sloppy price action and failed rallies. The regime flipped as designed, but the trade reversed so quickly that almost no model would have escaped the drawdown. It reinforces how messy and transitional early 2014 really was.
Trade 10 – Defensive Position During Growing Macro Stress
Instrument: GLD
Start: 2014-04-04
End: 2014-06-05
Length: 62 days
Return: –3.91%
This defensive window aligned with one of the most important macro stories of the decade: the beginning of the oil collapse. Weakness spread across commodities, emerging markets, and energy credit, producing a quietly deteriorating risk environment. Although GLD did not rally, being out of TQQQ helped reduce volatility exposure. The model essentially sat out a highly mixed and directionless period.
Trade 11 – Mid-2014 Strength Before the Storm
Instrument: TQQQ
Start: 2014-06-05
End: 2014-07-23
Length: 48 days
Return: +17.19%
Markets staged a strong rally into the summer of 2014, lifting tech and growth stocks meaningfully. The model captured this resurgence cleanly, participating in one of the last clear upside moves before macro turbulence intensified later in the year. Leadership broadened temporarily, and volatility receded. It was an ideal short-term environment for leveraged bullish exposure.
PHASE 3 — 2014–2015: Oil Collapse, Dollar Surge, and the Slow Topping Process
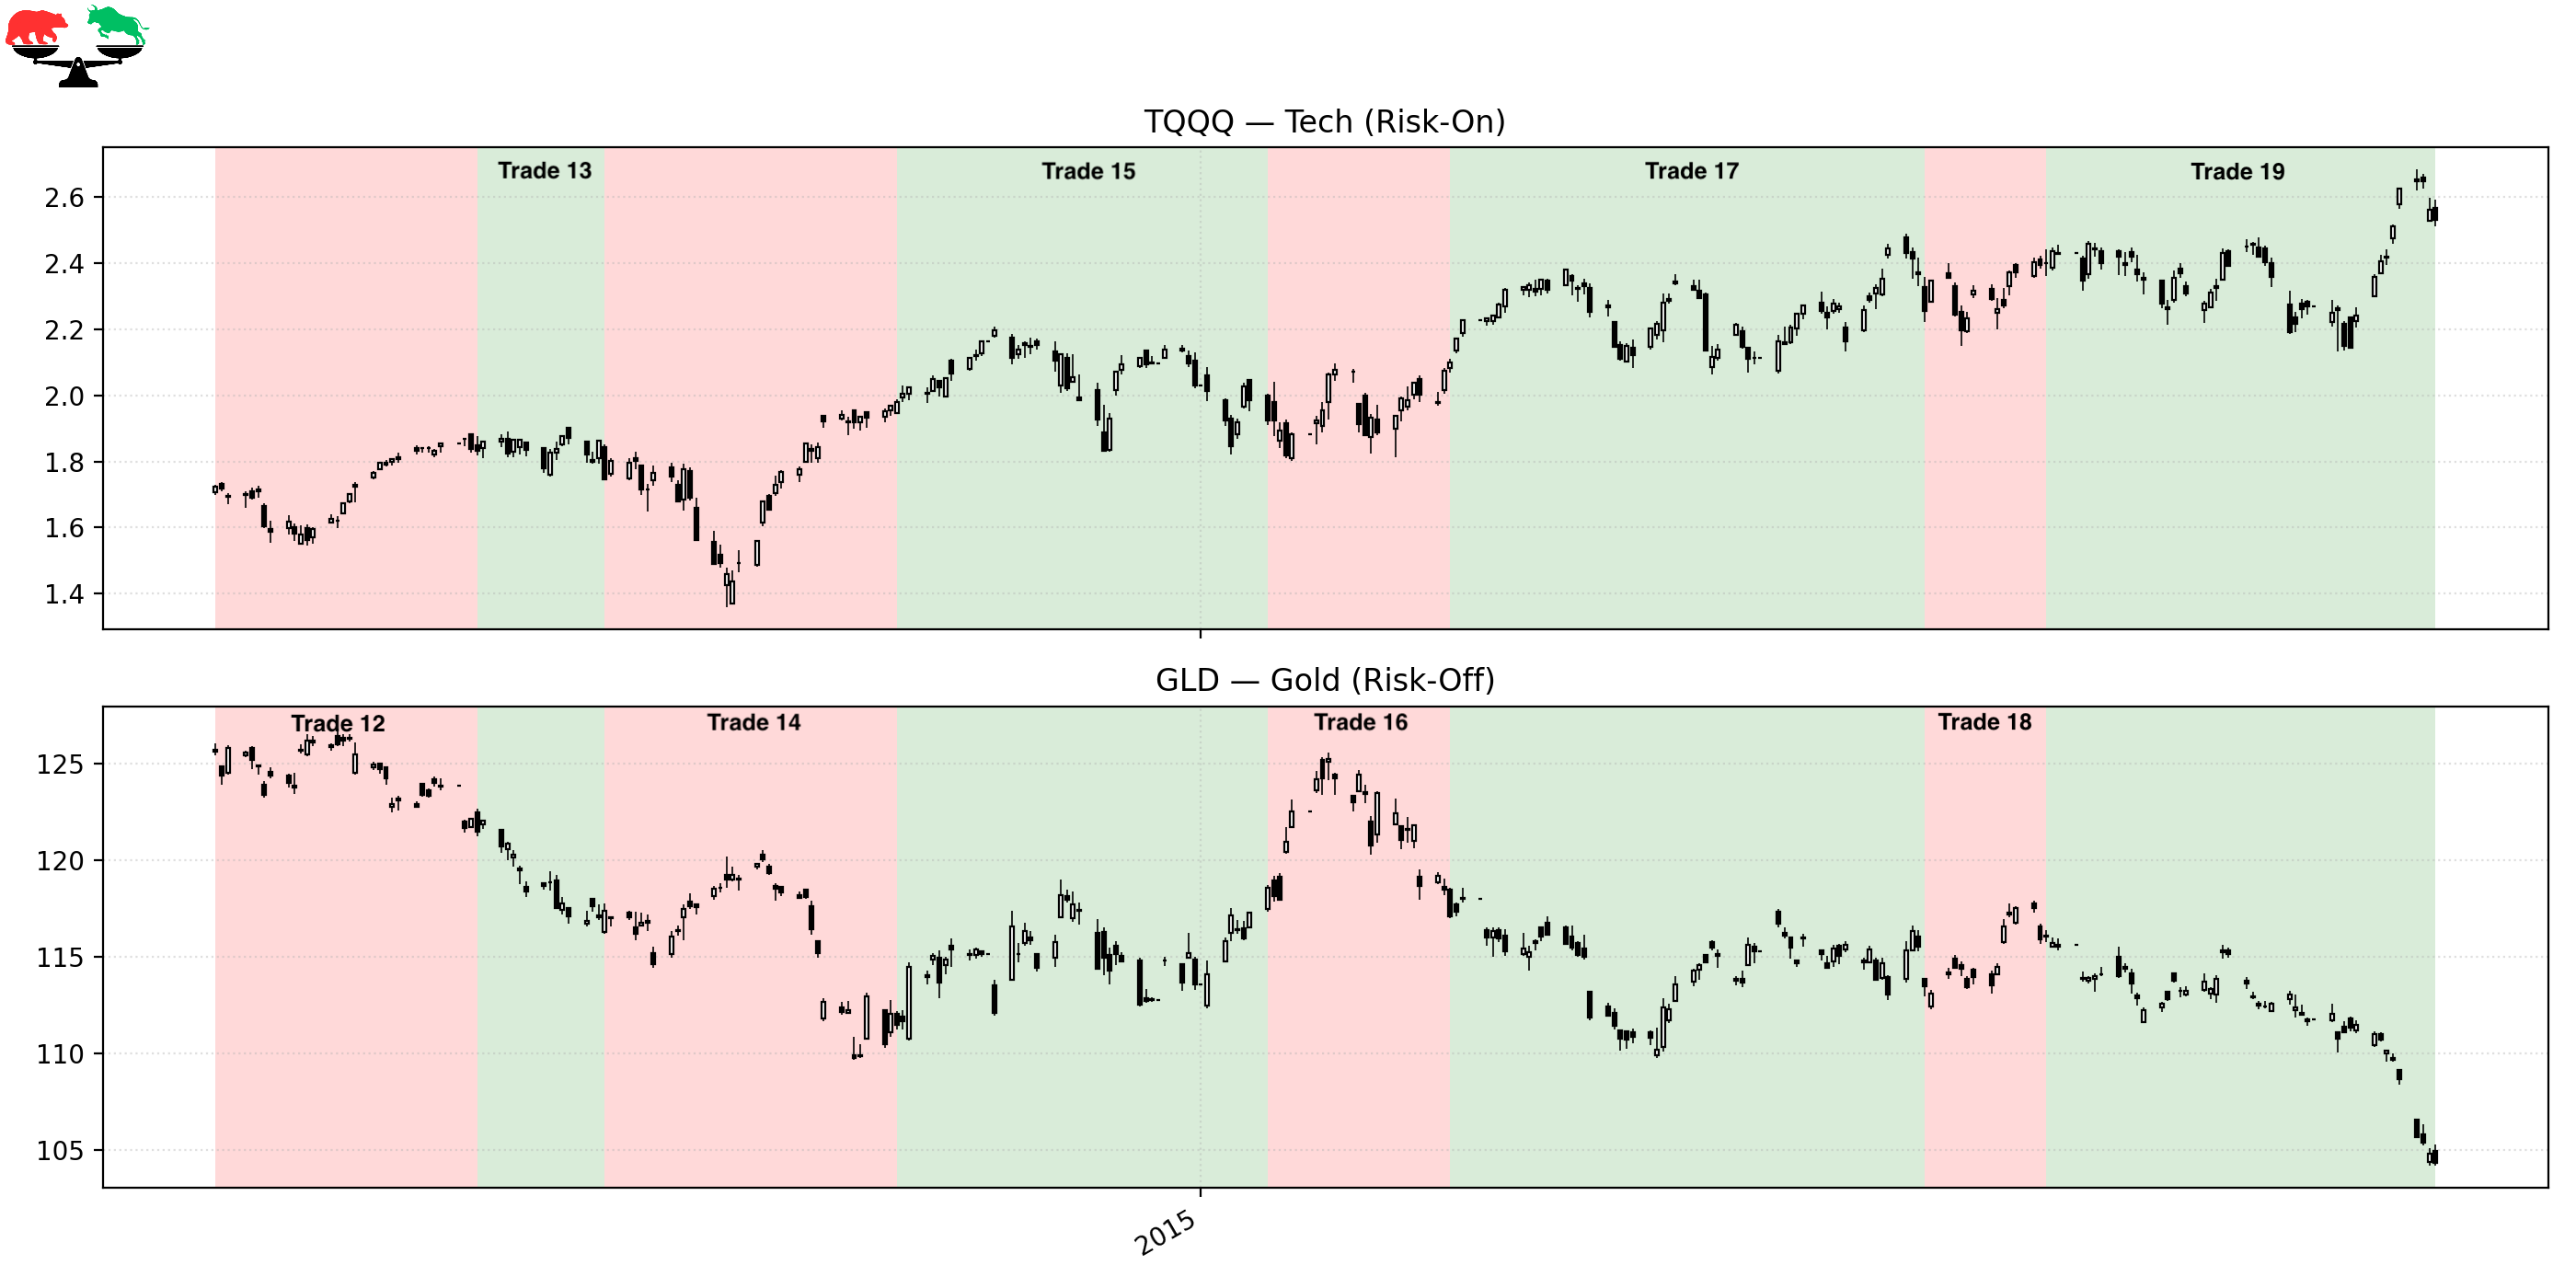
Trade 12 – Defensive During the Oil Collapse
Instrument: GLD
Start: 2014-07-23
End: 2014-09-04
Length: 43 days
Return: –3.30%
Oil prices began their historic collapse, falling sharply and destabilizing global credit markets. As fear increased, risk-on leadership faltered, and the model rotated into GLD. Gold didn’t provide strong returns, but the real benefit was avoiding the deterioration happening in tech and high-beta sectors. This was the early phase of a major macro transition.
Trade 13 – A Weak Bullish Attempt in a Deteriorating Tape
Instrument: TQQQ
Start: 2014-09-04
End: 2014-09-25
Length: 21 days
Return: –4.66%
Markets attempted a late-summer recovery, but participation was thin and volatility remained elevated. Leadership failed to broaden, and the advance lost strength almost immediately. The model followed the rules and re-entered TQQQ, but the rally failed again. This period showcased how unstable the market structure had become.
Trade 14 – Renewed Defensive Positioning as Stress Intensifies
Instrument: GLD
Start: 2014-09-25
End: 2014-11-12
Length: 48 days
Return: –5.02%
The oil crash accelerated, the U.S. dollar surged, and global markets weakened. These forces put pressure on nearly every risk-on segment of the market. Although GLD declined slightly, the defensive positioning avoided far worse results in high-beta equities. This was a textbook environment where the model chose resilience over aggression.
Trade 15 – Year-End Rally Fails to Hold
Instrument: TQQQ
Start: 2014-11-12
End: 2015-01-12
Length: 61 days
Return: –2.81%
A year-end rally emerged as markets attempted to shake off macro concerns. But despite holiday strength, breadth weakened and volatility increased again in early 2015. TQQQ couldn’t sustain gains in this environment, and the trade ultimately closed negative. This was the early phase of the 2015 topping process.
Trade 16 – Defensive Into Early 2015 Volatility
Instrument: GLD
Start: 2015-01-12
End: 2015-02-11
Length: 30 days
Return: –1.26%
With oil still collapsing and global data weakening, risk conditions deteriorated further. The model correctly stepped out of TQQQ, reducing risk during an unstable period. Though GLD did not appreciate, the defensive pivot was directionally appropriate. Sometimes the benefit of regime rotation is simply the risk not taken.
Trade 17 – A Final Bullish Push Before the Top
Instrument: TQQQ
Start: 2015-02-11
End: 2015-04-30
Length: 78 days
Return: +7.54%
Markets attempted one last meaningful push higher in early 2015. The advance lacked the broad participation seen in 2013, but still offered a respectable trend, especially in growth stocks. The model participated in this move while avoiding the choppy corrective phases on either side of it. This trade marked the last stable upside stretch before the global dislocation to come.
Trade 18 – Quick Defensive Rotation Before the Break
Instrument: GLD
Start: 2015-04-30
End: 2015-05-20
Length: 20 days
Return: +2.30%
The regime identified weakening leadership as markets rolled over again. A defensive shift into GLD helped sidestep increasing volatility and narrowing breadth. The trade produced a modest gain while reducing portfolio risk. This was a clean transition heading into a critical juncture.
Trade 19 – The Final Bullish Breath Before the China Shock
Instrument: TQQQ
Start: 2015-05-20
End: 2015-07-23
Length: 65 days
Return: +5.43%
This final Bullish trade ended on the exact day the regime flipped Bearish: July 23, 2015. Markets were showing classic topping behavior—divergences, narrowing leadership, and increasing fragility—yet still offered one more push higher. The model captured that final upswing while remaining agnostic to the looming macro risks. Weeks later, China’s surprise devaluation triggered one of the sharpest corrections since 2011, making this exit remarkably well-timed.
FINAL THOUGHTS
Here’s a recap of the trades taken during this period:
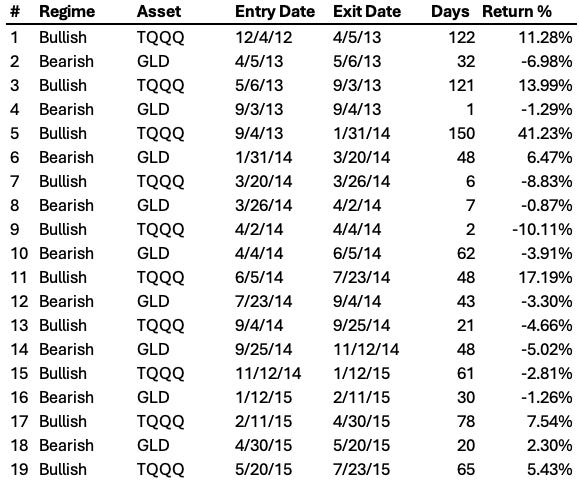
The 2012–2015 period turned out to be far more difficult than it appeared on the surface. Beneath the quiet strength of the broad indices, the underlying leadership was constantly shifting, producing a choppy, uneven environment where breakouts failed quickly and trends rarely followed through. The Market Regime model reflected that reality—getting whipsawed several times, cycling in and out of risk-on exposure, and experiencing a noticeable drawdown during the most volatile stretches of early 2014 and early 2015. But even with the false starts, failed rallies, and macro crosscurrents, the system stayed true to its rules and ultimately delivered a +56.16% total return, which is a ~18.46% CAGR. It wasn’t the smooth trending environment that defined 2010 - 2012, but it was a powerful demonstration of how a systematic approach can grind out meaningful gains even when conditions are far from ideal.
Coming Next: 2015–2018 — Crash, Reflation, Melt-Up, and Volpocalypse
Part 3 picks up at a dramatic turning point: the regime flipped Bearish on July 23, 2015—just weeks before China’s surprise devaluation triggered a violent global selloff. What followed was a whiplash series of events: the 2015–2016 correction, the explosive global reflation rally, the unstoppable 2017 melt-up, and finally the abrupt volatility shock of February 2018. This next chapter contains some of the most extreme market conditions the model has faced. And as always, the Market Regime system responded exactly the same way: unemotional, adaptive, and relentlessly consistent.
These historical reports show how the model handled the past.
Paid subscribers get to see how it handles the present.
If you want the same clarity in your trading today that this model brought to 2012–2015, join the paid community and follow along in real time.